The collective agreement negotiations for the university sector are currently underway. If no negotiation result is reached by March 31st, university employees and employers will enter a state without an agreement (sopimukseton tila in Finnish). Now is the time to give the work done by university staff the value it deserves – also in terms of salary.
The main goal of the negotiation organization JUKO, which represents university employees, is percentage-based general increases for everyone. Salary development naturally plays a big role in the negotiations, and the parties must consider how much room there is for increases and how they should be allocated. When considering these questions, it is good to examine the development of recent years.
Salary development of teaching and research staff
Sivista’s (Finnish Education Employees) university statistics publications from 2013–2023 and salary tables from 2010 onwards contain a lot of information about the salary development of university employees. The statistics show that the salary development of teaching and research staff has stagnated at all career levels.
Sivista’s statistical publications address both the overall picture of salary development and the development of “system-identical” individuals. The purpose of examining system-identical individuals is to look at the development of individuals who have remained “the same” in the statistics.
However, this system-identical indicator has the problem that in most variables it only describes the identical individuals of the respective examination years, and the numbers presented in Sivista’s salary statistics are not comparable in this regard.
For example, from the figures in the 2022 and 2023 statistical publications, it can be seen that at lower career levels, especially doctoral researchers, the annual development is faster than at later career levels. However, these figures do not include the same “identical” individuals, but due to the rapid cycle, many new individuals start at low demand and performance levels, and at the same time move to higher career levels. Thus, they are no longer included in the statistics as identical individuals. Therefore, the figures obtained from Sivista’s tables are not comparable, especially at lower career levels, even though such figures are presented.
The correct method is to examine the development of list salaries at different demand levels and the long-term changes in performance levels. These data can be found with very good accuracy usually in the appendix 1 of Sivista’s statistical publications, from which the 2023 table can be found in figure 1.
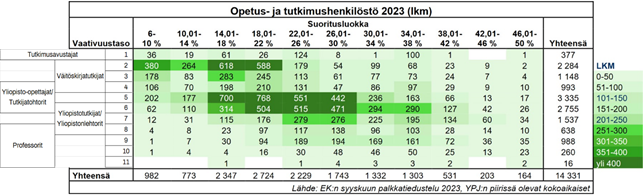
Figure 1: Distribution of university staff into demand levels and performance classes in 2023 and corresponding career levels. Source: Sivista’s statistical publication 2024.
The statistics show in numbers how university teaching and research staff are divided into different classes according to the demand of the work and performance in the task. The first thing that can be seen from the figure is that the performance classes of doctoral researchers, i.e., employees at demand levels 2–4, are systematically weaker than other career stages. By examining the average performance percentage by demand class for 2023, figure 2 is obtained.
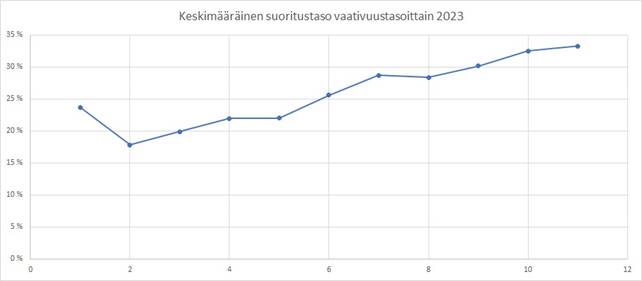
Figure 2: Average performance percentage by demand level in 2023.
The figure shows a very linear development in average performance percentages, except for demand level 1 (research assistants). Early career researchers are estimated to perform significantly weaker in early career tasks than those who have advanced further in more demanding tasks. Since only 1/3 continue an academic career after the dissertation, one could partly say that “weaker” performers drop out, but we do not see these continuing “better performers” at lower levels either. In other words, there are no highly successful performers at the early career stage, even though some of them do advance to higher demand and performance levels.

Figure 3 shows the proportions of those in the worst (6–10%) and best (46–50%) performance categories at different demand levels.
Salary development – list salaries
Above, only the performance comparison between demand levels was presented, which is not entirely straightforward. It is more essential to examine long-term salary development. List salaries usually rise as so-called general increases (from collective agreements), which in recent years have mainly been percentage-based, i.e., salaries have risen in relation to the previous salary. The table 4 below shows the changes in list salaries since 2011.

Figure 4: Salary increase percentages and amounts by demand level since 2011.
The increases have mostly been percentage increases, but for example, on May 1, 2011, and August 1, 2014, there were flat-rate increases, and on February 1, 2016, there was a small (13.30 €) minimum increase. In total, the list increases are relatively similar, around 19–21%, but as absolute increases, the range is 300–1300 € in salary development over about ten years.
Salary development – personal performance
Personal performance is a coefficient of 6–50% of the list salary in the university’s salary system, which is determined based on performance at work. Performance is evaluated in relation to the respective demand level. Above, differences between demand levels were discussed, but what does the situation look like at performance levels?
Figure 5 shows the development of performance levels since 2013. The rise in 2019 was due to the transition from the old 1–9 performance level classification to the 6–50% model, where the removal of the smallest performance percentages raised averages. At many demand levels, especially at the starting doctoral researcher level 2, the average dropped back down in 2020. At higher levels 8–11 (mainly professors) and level 1 (research assistants), this rise has remained.

Figure 5: Development of performance levels relative to 2013. Demand level 11 relative to 2016. The average is the average of demand levels, not the entire staff.
Salary development relative to cost level
Although slight career-level differences can be found from the above figures, in practical terms, the relationship of salary amounts to the cost level is more important. By combining university salary solutions and performance level changes with the change in the cost-of-living index from 2010–2023, which was 131.11%, figure 5 is obtained.
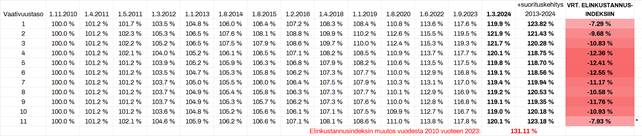
University teaching and research staff’s real salaries have thus dropped by about 7–13% based on these data. Small differences between career levels are not as significant compared to the overall drop in salaries.
The figures lack performance level data from 2010–2013, and possible demand or other allowances are not taken into account.
This outcome is an expected result of university staff repeatedly receiving too low increases. Universities can no longer often compete with the salaries of research institutes, universities of applied sciences, or even secondary school teachers. Universities have a significant role in developing RDI activities and Finland’s competitiveness, but it suffers greatly when increasingly more work is done cheaply or even as volunteer work. University employees’ salaries must correspond to the expertise and the demands of the tasks.
University staff are known to be very conscientious and have continued to work hard through increasing workloads, declining salaries, and the corona years. Now is the time to show the value of all this.
Pauli Väisänen
Postdoctoral Researcher and Member of the Board of the Union of Research Professionals